① The Problem
Heart Disease Is the World's #1 Killer — Its Molecular Drivers Are Largely Unknown
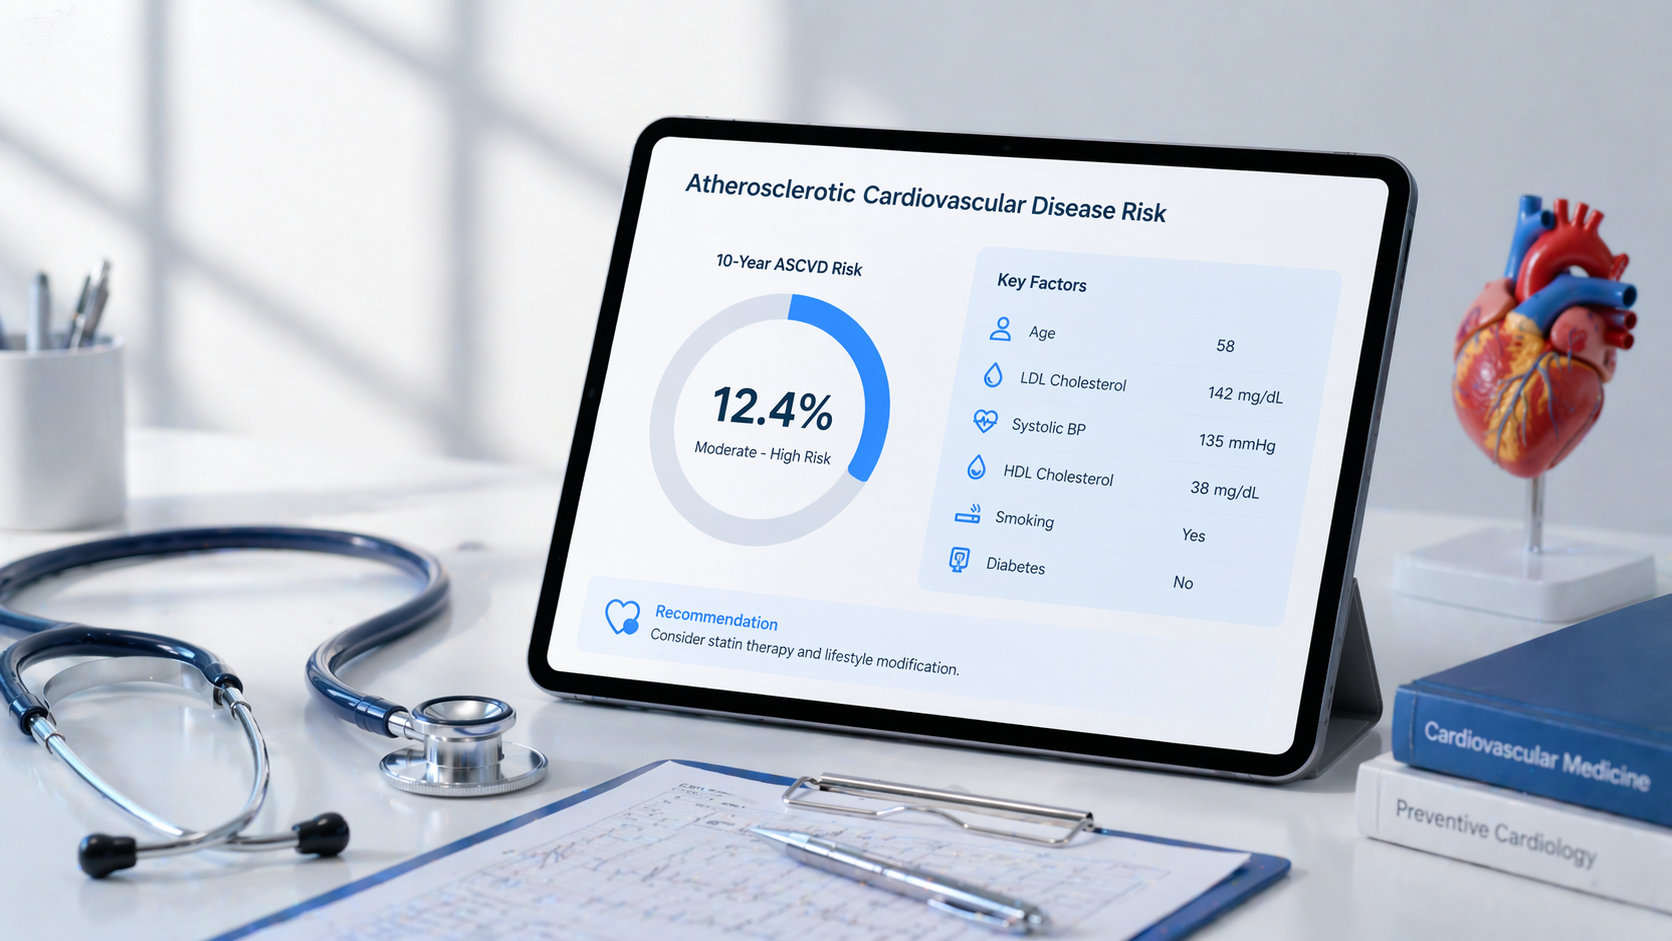
Cardiovascular disease accounts for nearly 1 in 3 deaths globally. While risk scores
like the ACC/AHA ASCVD tool estimate 10-year event probability from clinical features,
the underlying molecular mechanisms — the metabolite fingerprints that distinguish
a future heart attack victim from someone who will stay healthy — are poorly understood.
Metabolomics offers a direct window into these biochemical perturbations, capturing
real-time snapshots of how your metabolism shifts as cardiovascular risk builds.
Global CVD Death Share
0%
Of all global deaths are cardiovascular. More than cancer, diabetes, and respiratory disease combined.
📈 10-Year ASCVD Risk Distribution Across Study Population (n = 1,102)
620
Low Risk
ASCVD score 0–5%
56.3% of cohort
110
Borderline Risk
ASCVD score 5–7.5%
10.0% of cohort
225
Intermediate Risk
ASCVD score 7.5–20%
20.4% of cohort
147
High Risk
ASCVD score ≥ 20%
13.3% of cohort
🧬
Metabolic Shift
Acylcarnitines & amino acids signal dysfunction early
🔥
Inflammation
Lipid peroxidation & vascular stress escalate
🩸
Atherosclerosis
Plaque formation in coronary arteries
🏥
ASCVD Event
Stroke, MI or coronary death within 10 years
② The Data
A Large-Scale Iranian Metabolomics Cohort — 50 Metabolites, 4 Risk Groups
Participants were randomly selected from the STEPs 2016 national survey covering
31,050 individuals across Iran. Individuals aged 40–79 with LDL <190 mg/dL and no
pre-existing ASCVD were enrolled. Fasting plasma was collected and analysed via
FIA-MS/MS (flow-injection tandem mass spectrometry) — a fast, accurate approach
that simultaneously measures acylcarnitines and amino acids. Critically, the 10-year ASCVD
risk score was calculated per 2013 ACC/AHA guidelines for each participant, enabling
stratified comparisons across four clinically meaningful groups.
1,102
Eligible participants with full metabolomics + ASCVD risk profiling
53%
Female participants in the study
54.4
Mean age (years ± 10.2)
30
Acylcarnitines measured per sample
20
Amino acids measured per sample
Participant Distribution by Age Group & Sex
Strongest Metabolite–ASCVD Correlation: C16OH (3-OH-hexadecanoylcarnitine)
r = 0.279, p < 0.001
The long-chain acylcarnitine C16OH showed the strongest positive association with the 10-year ASCVD score — evidence of disrupted fatty-acid oxidation as cardiovascular risk climbs. All 30 acylcarnitines were positively correlated with the ASCVD risk score.
Blood was sampled after ≥ 12 hours overnight fasting — critical because acylcarnitines show stronger associations with CVD risk in fasting subjects. Metabolites were quantified using the derivatisation butanol-HCL method with a SCIEX API 3200 triple quadrupole mass spectrometer.
③ The Method
From 50 Raw Metabolites to 14 Actionable Biomarkers
With 50 highly correlated metabolites and only 1,102 participants, a naïve regression
would suffer from multicollinearity and loss of interpretability. The solution: first reduce
dimensionality with Principal Component Analysis (PCA) to group correlated metabolites
into independent factors, then apply logistic regression on those factors to identify
ASCVD risk predictors, and finally use MetaboAnalyst pathway enrichment
(KEGG database) to map the biology.
📊
Naïve Approach
Test all 50 metabolites individually against ASCVD risk. Severe multicollinearity (correlated metabolites inflate error). Multiple testing burden (50 comparisons). Results hard to interpret biologically.
⚠ Collinearity Problem
🔬
PCA + Pathway Enrichment
Group correlated metabolites into 10 orthogonal (uncorrelated) factors via PCA. Regress factors against risk groups. Identify enriched KEGG metabolic pathways among significant metabolites.
✓ Interpretable & Robust
PCA Scree Plot — Metabolite Factors by Variance Explained
🔬
FIA-MS/MS
30 acylcarnitines + 20 amino acids measured from fasting plasma per participant.
📐
PCA + KMO Test
KMO = 0.874, Bartlett p < 0.001. Varimax rotation → 10 orthogonal metabolite factors.
📈
Logistic Regression
Binary logistic regression for each risk group vs. low-risk. OR, 95% CI, adjusted for BMI.
🗺️
Pathway Enrichment
MetaboAnalyst v5.0 / KEGG: enrichment ratios for metabolic pathways per risk comparison.
① Measurement
- Flow injection tandem MS
- SCIEX API 3200 (ESI)
- Butanol-HCl derivatisation
- Internal standard calibration
② PCA
- Z-score standardisation (ln)
- Eigenvalue > 1.0 criterion
- Loadings > 0.4 retained
- Varimax Kaiser rotation
③ Regression
- Low-risk as reference category
- Stepwise multiple linear reg.
- Benjamini-Hochberg FDR
- BMI-adjusted sensitivity
④ Pathways
- MetaboAnalyst v5.0
- KEGG metabolic database
- Fisher's exact test (enrichment)
- p < 0.05 significance
④ Results
14 Biomarkers Pinpointed — Three Metabolic Pathways Dominate Risk
Multiple linear regression on all 50 metabolites distilled 14 significant ASCVD predictors:
3 acylcarnitines and 11 amino acids. PCA logistic regression confirmed that 8 of 10 factors
were significantly elevated in high-risk patients while one protective factor (glycine/serine/threonine)
was significantly depleted. Pathway enrichment revealed the dominant metabolic perturbations
driving risk stratification.
14
Significant metabolite predictors of 10-year ASCVD risk
3 acylcarnitines + 11 amino acids
1.570
Highest odds ratio — Factor 10 (ornithine + citrulline)
in high-risk vs. low-risk group
0.741
Lowest odds ratio — Factor 9 (glycine, serine, threonine)
Protective — depleted in high-risk
Pathway Enrichment Ratios — Low-Risk vs. High-Risk Group (Top Pathways)
| Factor | Key Metabolites | OR (High-Risk) | 95% CI | p-value | Status |
|---|
| Factor 1 | 12 long-chain acylcarnitines | 1.103 | (1.072–1.134) | <0.001 | ↑ Elevated |
| Factor 5 | 6 short-chain acylcarnitines | 1.205 | (1.128–1.287) | <0.001 | ↑ Elevated |
| Factor 7 | Alanine, proline | 1.343 | (1.140–1.582) | <0.001 | ↑ Elevated |
| Factor 10 | Ornithine, citrulline | 1.570 | (1.338–1.841) | <0.001 | ↑ Elevated |
| Factor 9 | Glycine, serine, threonine | 0.741 | (0.642–0.856) | <0.001 | ↓ Protective |
| Factor 4 | — | 0.971 | (0.907–1.039) | 0.395 | Not significant |
| · · · Factor 2, 3, 6, 8 also significant (OR 1.063–1.229) — see full paper · · · |
🧪
The 14 Key Biomarkers Identified
Three acylcarnitines (C4DC, C8:1, C16OH) and eleven amino acids (citrulline, histidine, alanine, threonine, glycine, glutamine, tryptophan, phenylalanine, glutamic acid, arginine, aspartic acid) emerged as significant ASCVD predictors from multiple linear regression — even after BMI adjustment. These represent potential early-detection targets for risk stratification before clinical disease manifests.
🥩
BCAA Metabolism
Leucine, valine, isoleucine dysregulation
→
⚡
Metabolic Stress
Acylcarnitine accumulation signals mitochondrial dysfunction
→
🔥
Vascular Injury
Endothelial dysfunction; phenylalanine pathway disrupted
→
❤️
ASCVD Event
Stroke, MI, or coronary death within 10 years
⑤ Takeaways
What This Means Beyond the Numbers
01
A 14-Metabolite Cardiovascular Fingerprint
C4DC, C8:1, C16OH, and 11 amino acids provide a blood-based molecular signature of ASCVD risk — potentially detectable years before a clinical event or symptom appears.
02
Amino Acids Matter as Much as Lipids
Conventional CVD risk focuses on cholesterol. This study shows amino acid pathways — especially BCAA biosynthesis and glutamate/glutamine metabolism — are equally important predictors of cardiovascular fate.
03
Glycine & Serine Are Protective
Factor 9 (glycine, serine, threonine) was the only factor inversely associated with risk (OR = 0.741). These amino acids may be therapeutic targets — dietary or pharmacological supplementation warrants investigation.
04
Metabolomics Upgrades Risk Prediction
Adding metabolomic profiling to the standard ASCVD score could identify high-risk individuals who are missed by traditional biomarkers — enabling earlier, more personalised preventive intervention in clinical practice.